A couple of years ago I bought a coach and converted it into an RV. After the first season, I parked it and hooked up a battery charger to keep the batteries charged during winter. When the winter was over, I found out that the charger blew a fuse and my batteries were dead. I decided to add some monitoring. I bought a Victron BMV 702 battery monitor (which has both a display and a serial connection), hooked it up to an ESP32 microcontroller and started fiddling around with it. Soon the project exploded. I hooked up a couple of DS18b20 temperature sensors, my Victron MPPT solar charge controller (which has a serial connection as well) and a cheap GPS module I bought off eBay.
Hardware specs:
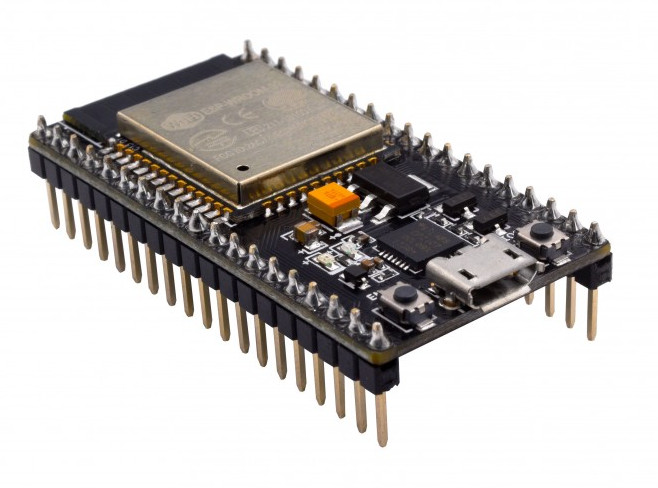
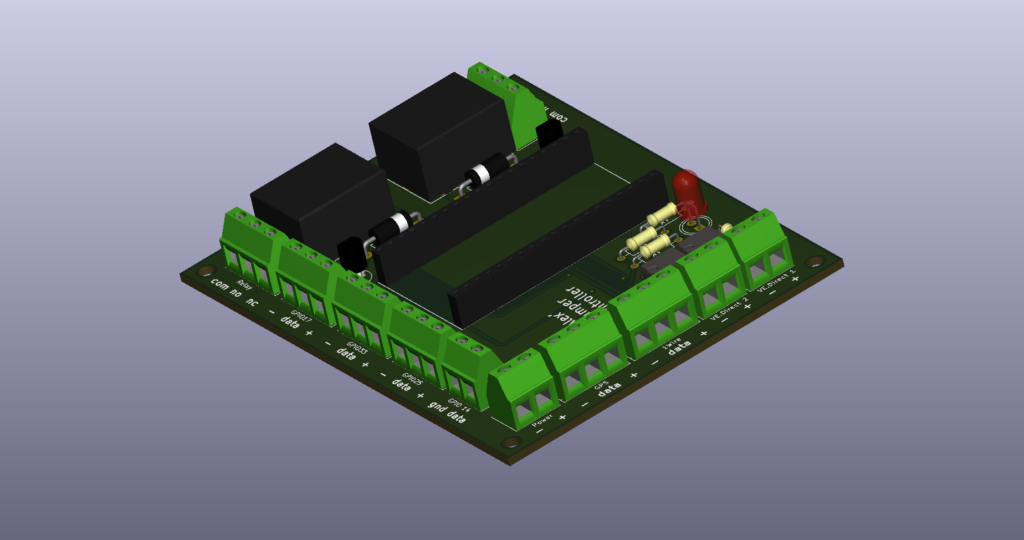
- ESP32 microcontroller (with built-in WiFi)
- USB connection for programming/debugging
- Power input (5V)
- 2 Optically isolated serial inputs (for Victron VE.bus)
- 1 Non-isolated serial input (for GPS receiver)
- “1-wire” I/O (for Dallas DS18B20 temperature sensors)
- 3 General purpose I/O’s (can be used as digital input or output, analog input, PWM output, RS232. I2C etc)
- 2 Onboard relays (dry contact outputs)
Software:
The software is written in C++ using the Arduino IDE.
Current software features :
- Reading and parsing of VE.bus messages from a Victron BMV series battery monitor.
- Reading and parsing of VE.bus messages from a Victron MPPT solar charge controller.
- Reading various temperatures (inside, outside, hot water, etc.) using up to 10 Dallas DS18B20 1Wire temperature sensors.
- Reading and parsing of NMEA data from a GPS receiver.
- GPS location upload supports both GeoHash and Lat/Lon.
- Reading a resistive tank level sensor.
- Measurements can be uploaded to a server using http(s) GET.
- Measurements can be written directly to Influxdb. Both http and https are supported.
- Switching on the 24V to 12V DC/DC converter to charge the 12V battery if the 24V battery voltage is above a certain level. Switching of if the voltage drops below a certain level. The DC/DC converter is switched by one of the two onboard relays. 24V battery voltage measurements are read from the Victron BMV battery monitor.
- Data upload is encrypted (HTTPS).
- Over-the-air software updates (OTA). New software images are automatically downloaded on a seperate partition of the flash memory and verified. If verification is successfull, the ESP32 automatically boots the new image. Both upgrades and downgrades are supported.
- Most settings (WiFi SSID and password, Influxdb hostname, username/password, what measurements to write etc) are configurable through the web interface.
- Settings are stored on a separate partition of the SPI Flash File System (SPIFFS) and are therefore not lost after a software upgrade.
- Measurement collection runs in a separate background task.
- All measurements can be downloaded directly from the web interface in JSON format.
- A portal is available for those who do not want to set up their own server for software updates etc. When using the portal for management, data can still be written to your own Influxdb instance.
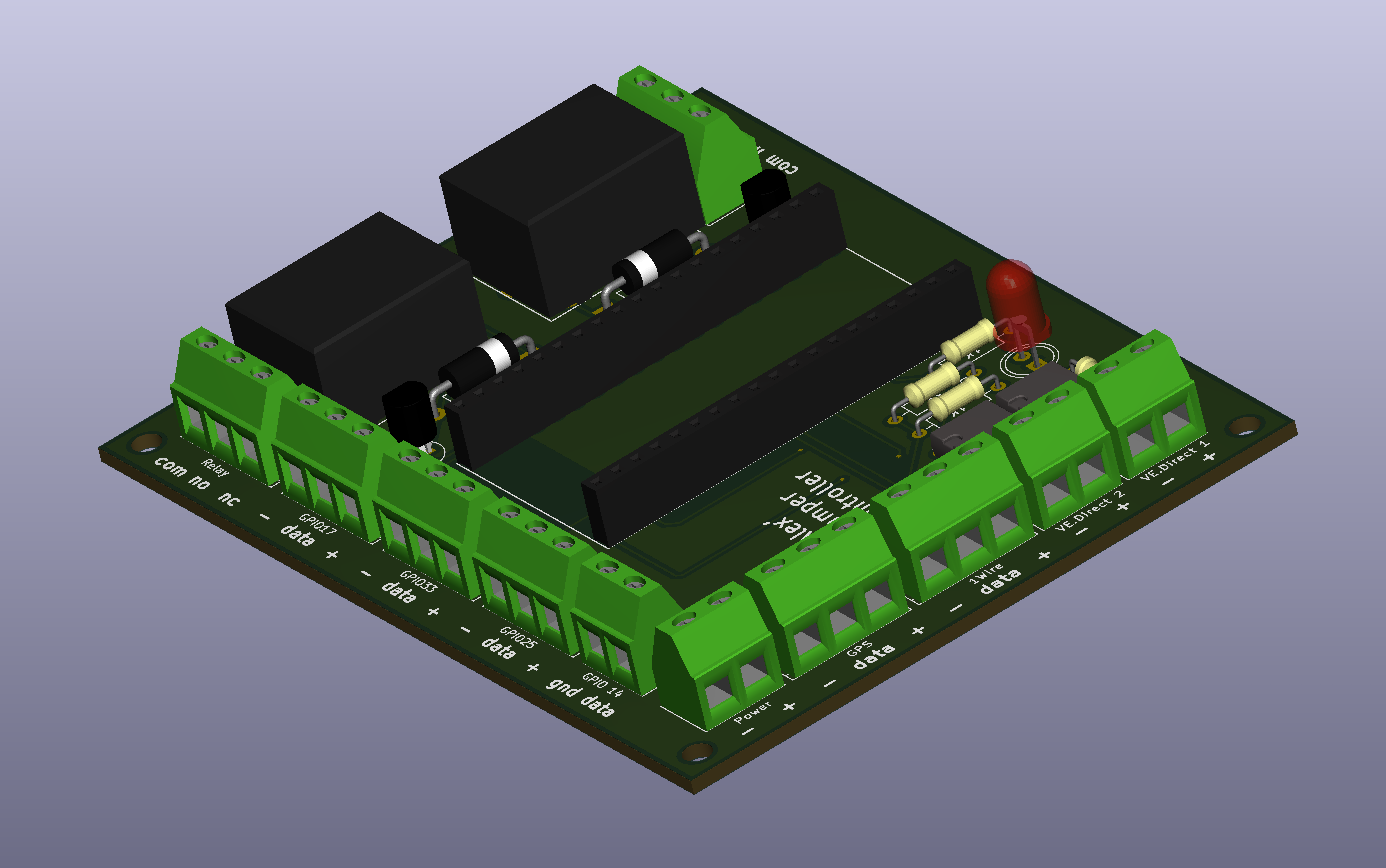
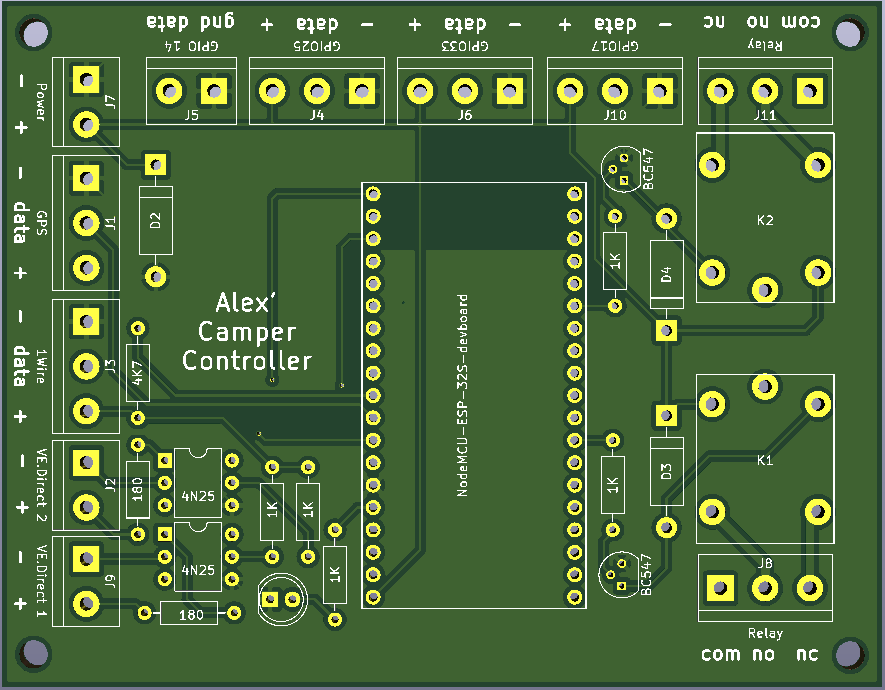
PCB:
Todo’s:
None of the items on my todo list require any hardware updates. Luckily the ESP32 is flexible enough to facilitate all the things I thought of after I had the PCBs produced. Until now, at least 🙂 This is mainly because of the built-in matrix switch which allows you to assign any function (like UART RX, UART TX, digital in, digital out, analog in, PWM out) to any IO pin.
- Add an extra temperature sensor to measure the temperature of the water heater. No extra I/O’s needed, extra sensors can be connected parallel to the existing ones since every DS18B20 sensor has a unique address.
- Make the resistive tank sensor configurable.
- Finish the portal.
- Tweak the “12V charger on/off” criteria.
Links:
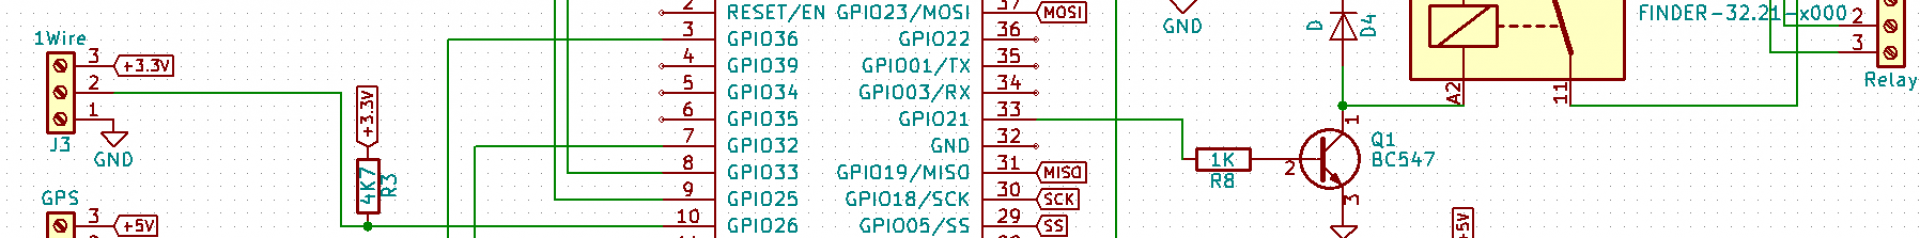
The schematics and PCB design can be found in the download section.
The code is on GitHub.
The portal can be found at https://camperlogger.tarthorst.net/.
The live telemetry page of my bus can be found here.
I visualize the data using Grafana.